A slow website loses visitors: nobody waits on a phone. On top of that, Google uses the Core Web Vitals among its page experience signals. The simplest way to measure all this is free: PageSpeed Insights, Google's own tool. Here's how to use it and, above all, how to read the report without getting lost, using my own website as a real example.
Step by step
- Open pagespeed.web.dev.
- Paste the full address of the page (for example your home page or a product page) and click Analyze.
- Wait about 30 seconds. The report has two tabs: Mobile and Desktop. Look at mobile first: it's the toughest test and the one most of your visitors use.
- The Copy link button saves the report so you can share it or compare later.
Two parts that don't measure the same thing
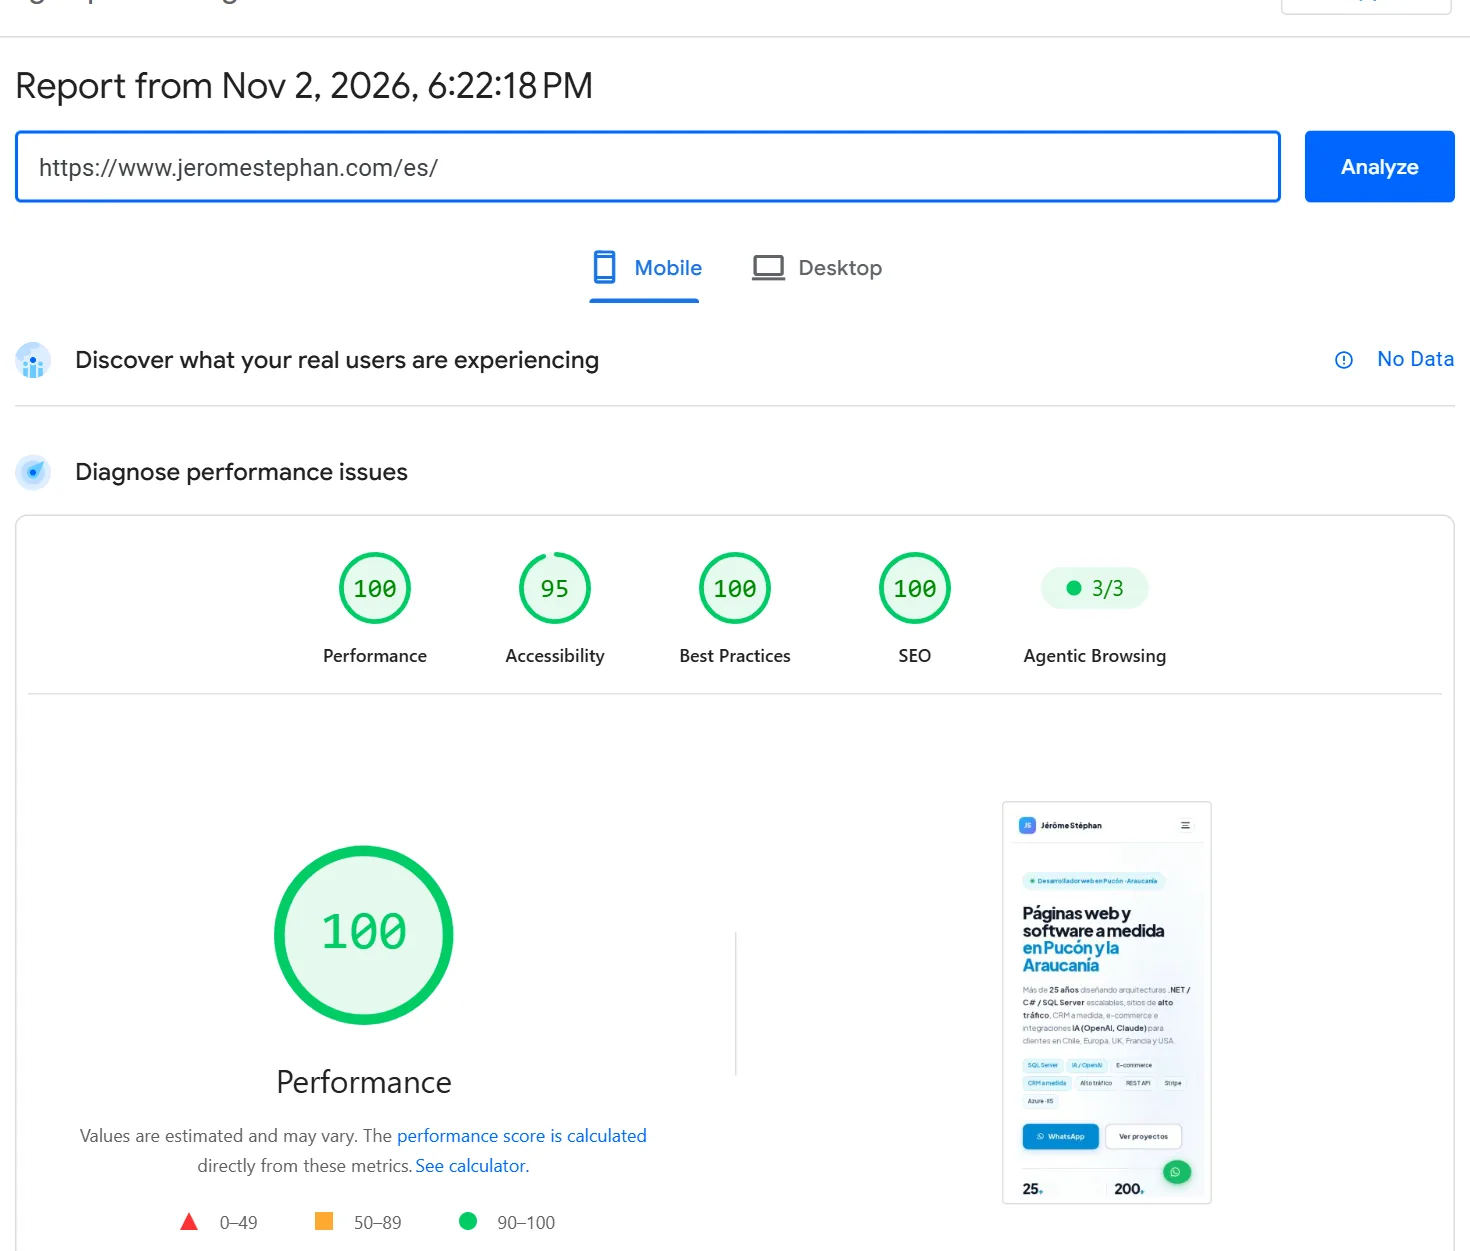
- "Discover what your real users are experiencing": field data, measured in your visitors' Chrome browsers (the CrUX report). According to Google, it's the 75th percentile over the last 28 days. If your page doesn't have enough traffic, PageSpeed falls back to data for the whole site, and if that's not enough either, it shows "No Data": that's the case for my site and for most small businesses. It's not an error.
- "Diagnose performance issues": lab data. Lighthouse loads the page once on a simulated phone (in my report, a Moto G Power on slow 4G). That's where the 0 to 100 score comes from.
The metrics and their thresholds
These are Google's official thresholds for field data (PageSpeed Insights documentation):
| Metric | What it measures | Good | Poor |
|---|---|---|---|
| LCP (Largest Contentful Paint) | When the main element (photo, heading) appears | up to 2.5 s | over 4 s |
| INP (Interaction to Next Paint) | How fast the page responds to a tap or click | up to 200 ms | over 500 ms |
| CLS (Cumulative Layout Shift) | How much content moves around while loading | up to 0.1 | over 0.25 |
| FCP (First Contentful Paint) | When the first content appears | up to 1.8 s | over 3 s |
| TTFB (Time to First Byte) | How long the server takes to respond | up to 0.8 s | over 1.8 s |
The first three are the Core Web Vitals: a page passes the assessment only if all three are green.
How the score is calculated
The lab score is a weighted average of five metrics (Lighthouse documentation): Total Blocking Time 30%, LCP 25%, CLS 25%, FCP 10% and Speed Index 10%. 90 to 100 is green, 50 to 89 orange, below 50 red. Total Blocking Time measures how long JavaScript blocks the page: that's why third-party scripts (chat, ads, analytics) drag the mobile score down so much.
My own site as an example
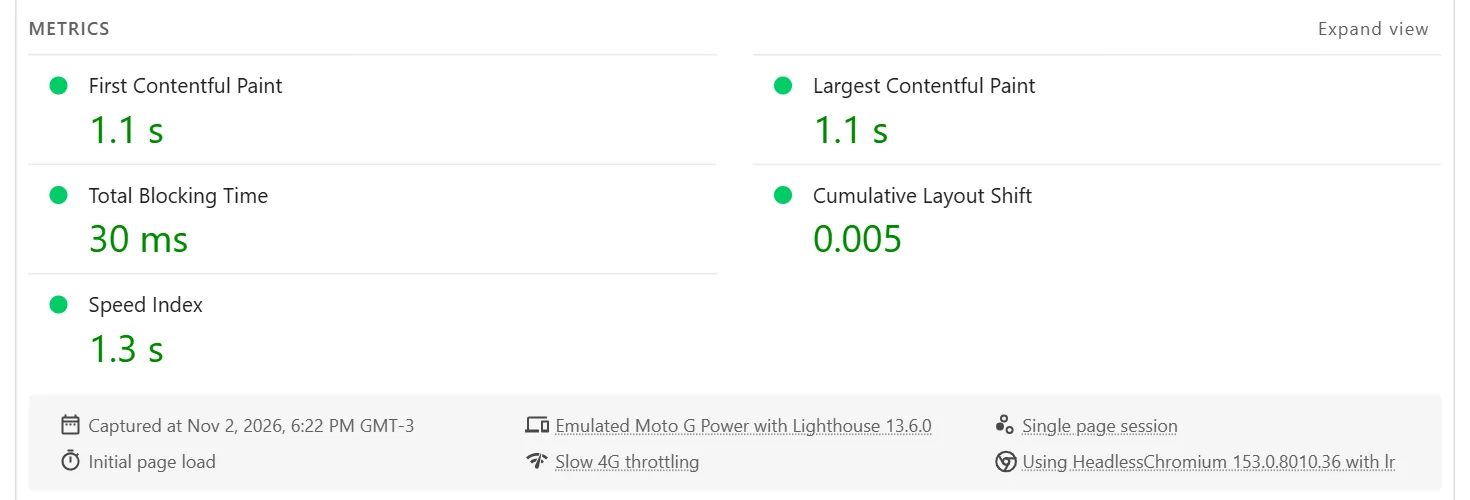
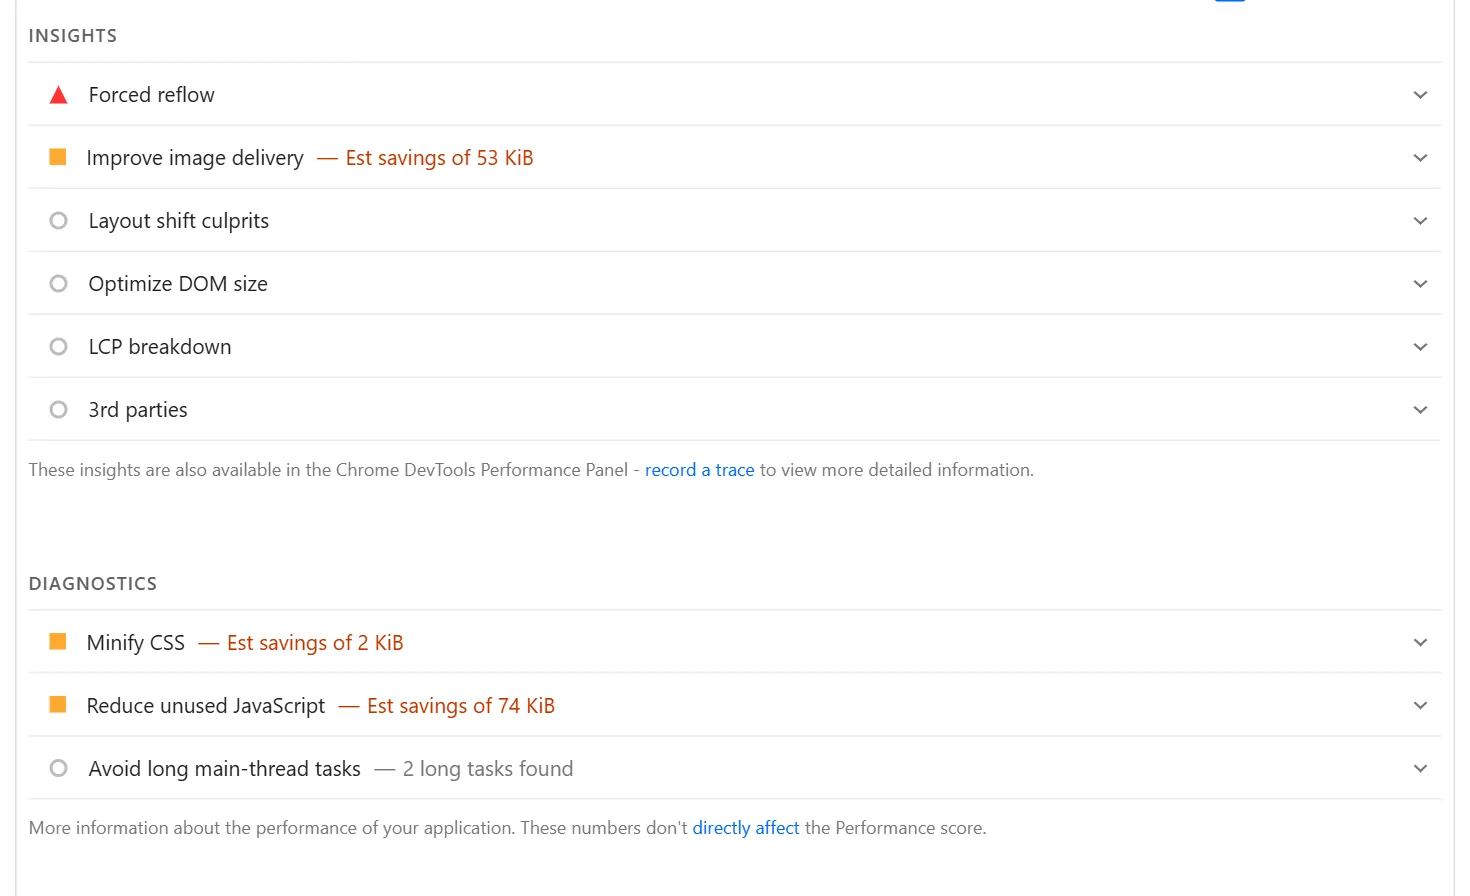
On 2 November 2026, my home page scored 100 on mobile: an LCP of 1.1 s, a Total Blocking Time of 30 ms and a CLS of 0.005. Even so, the report suggests improvements: about 53 KiB to save on images, 74 KiB of unused JavaScript and 2 KiB of CSS. And accessibility stays at 95 because of a colour contrast issue.
A lesson I learned: in October, measuring with Lighthouse on my own computer, the same home page scored between 60 and 72. The score varies with the machine, the network and whatever else is running. So always compare with the same tool, and run the test two or three times before drawing conclusions.
What usually drags the score down
- Heavy images: photos of several megabytes, not in WebP and not resized for phones. It's the number one cause I see in small businesses.
- Videos on the home page: a background video can weigh more than the rest of the site put together.
- Too many third-party scripts: chat, ad pixels, several analytics tools.
- Blocking fonts: typefaces loaded before the text; load them without blocking.
- Content that jumps: images without a declared width and height, banners popping in at the top (poor CLS).
- A slow server: cheap, overloaded hosting shows in the TTFB, before anything even loads.
My tips
- Also test the pages that matter most: a product, a booking page, the contact form, not just the home page.
- Don't chase 100 at any cost: going from 85 to 100 changes little; going from 30 to 80 changes a lot.
- If your site has traffic, check the Core Web Vitals report in Search Console: it groups all your pages with real data. I explain it in Google Search Console step by step.
- Speed is useless if Google doesn't see your pages: also check why Google isn't indexing a site.
My websites are custom-built with ASP.NET Core, precisely so they load fast (I compare it with WordPress in this article). If you'd like me to look at yours, see my website services or get in touch.
Is your website slow?
I'll tell you what's holding it back and what it costs to fix, with a clear proposal.
Get my free quoteMessage me on WhatsApp